


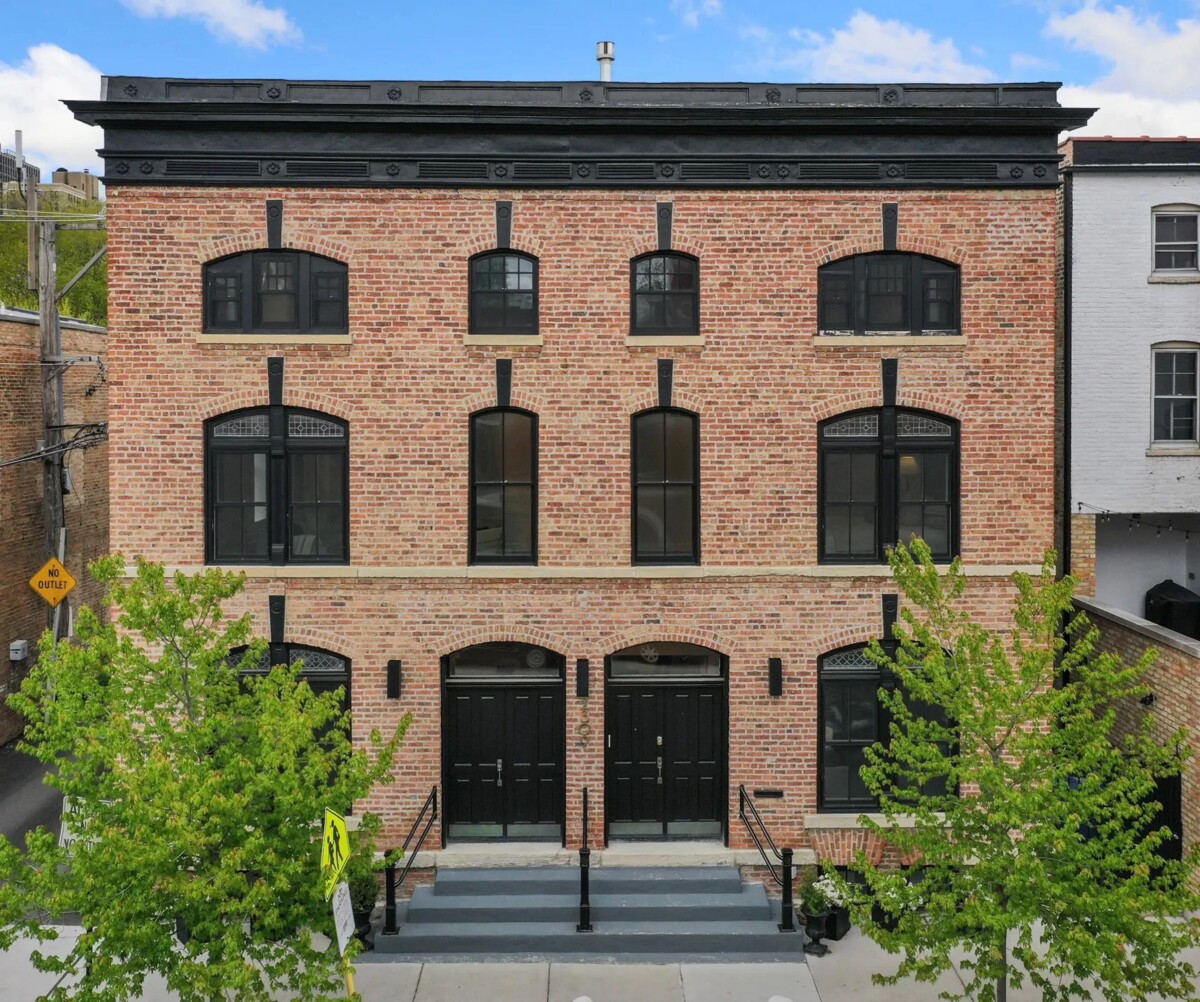
Important points
DuPage County was a seller’s market in June. Prices rose four times faster than the national pace, with more than half of homes selling for more than their asking price. The median sales price reached $477,652, up 9% year-over-year, as sellers gained new confidence in pricing. The number of new listings rose 16%, the largest monthly increase in supply in more than a year.
DuPage County, Illinois Housing Market Snapshot
Median Sales Price Pending Sales Active Listing Days Market Listing Days Sold on List $477,652 (+8.6% YoY) 1,284 (+3.4% YoY) 3,924 (+9.0% YoY) 44 days (+1 day YoY) 51.3% (-2.7 ppt YoY)
DuPage County’s housing market delivered strong seller returns in June, but new cracks have appeared beneath the surface. Prices rose and housing moved quickly, but inventory expanded at a significantly faster pace than in recent months. This combination meant significant profits for sellers and significantly increased options available to buyers for the first time in over a year.
Here’s what buyers and sellers need to know about DuPage County, Illinois as we head into late summer.
A snapshot of the US housing market
Median Sales Price Pending On Sale Active Listing Days Balance of Buyers and Sellers on Market $408,776 (+2.2% YoY) 349,254 (+4.5% YoY) 1,496,490 (+0.8% YoY) 49 Days (+1 Day YoY) Number of sellers outnumber buyers by 48.5%
Markets across the U.S. have inched ahead, with prices up 2% and transactions up about 5%, but supply remains essentially unchanged. In DuPage County, the gap widened. Local prices rose nearly four times faster than national prices, supply expanded by about 9% while national inventories remained largely unchanged, and home sales were five days faster than the national median.
“June marked a crossroads in the continued recovery of the housing market,” said Chen Zhao, head of economic research at Redfin. “Prices rose faster than in recent months, with economic uncertainty related to the Iran war and rising mortgage rates spooking some home buyers and sellers.On the bright side, home sales are trending upwards and wages have risen faster than prices, helping There are areas of competition in the Midwest, Northeast, and Gulf Coast regions, but in general, consumers are still weathering a difficult period. Still, economists expect the market to improve gradually over the next few years.”
Prices in DuPage County rise four times the national rate
DuPage County sellers commanded higher prices than a year ago for three straight months, and profit margins continued to increase. The median sales price in June reached $477,652, an increase of nearly 9% from a year ago, compared with only about 2% nationally. Dupage has appreciated by about 62% since the beginning of 2020, and after a brief deceleration in late 2025, the pace of growth has reaccelerated. Median price per square foot rose about 4% year-over-year to $258, confirming an increase in underlying values rather than a shift to larger properties.
Price reductions remained small. Only about 10% of active listings in DuPage County reduced their prices, essentially unchanged from a year ago and well below many comparable suburban markets. Typical homes sold for about 1% above list price, and the average sale rate held steady at 101.2%. Sellers priced with confidence, and buyers consistently met their expectations.
Buyers kept pace with the surge in listings
The number of pending sales in DuPage County reached 1,284 in June, an increase of about 3% from the same month last year, showing that buyer demand continued to absorb a 16% surge in new listings. Closed sales showed a similar story, with 1,243 homes sold, an increase of about 7% year over year. The median time on market increased by just one day to 44 days, and about 57% of homes went under contract within two weeks. This is down about 4 points from last June, but still reflects an exceptionally fast-moving market.
Nationally, pending sales increased by about 5%, the median time on market remained at 49 days, and about 31% of homes went under contract within two weeks. DuPage County slightly outpaced national pending sales growth while absorbing nearly twice as fast. A slight decline in the share of two-week contracts suggested a little more room for buyers, but overall demand conditions remained strong.
Inventory increases as more sellers return
The number of new listings increased by about 16% year-on-year to 1,441, the largest increase in monthly supply in more than a year, but the number of new listings nationwide remained flat. Available inventory increased by about 9% to 3,924, a significant expansion compared to a national increase of less than 1%. Sellers who were out are coming back, driven by higher prices and faster timelines. Days of inventory is now 30 days, down from 32 days a year ago. This means that housing continued to be absorbed before inventory was built up.
Despite the increased supply, DuPage County’s supply was only 2.1 months, well below the national supply of 3.7 months. This level remains favorable for sellers. Fresh inventory gave buyers more options, but it didn’t fundamentally change their bargaining power. Demand absorbed new supply almost as quickly as it appeared.
Luxury homes led price increases, but entry-level growth slowed
Median price tier (YoY) Sold (YoY) DOM (YoY) Listing rate (YoY) Luxury (top 5%) $1,565,539 (+10.0%) 194 (+7.2%) 45 days (-11 days) 45.4% (+11.1 ppt) High price (65th – 95 %) $593,273 (+4.0%) 1,126 (+5.0%) 41 days (-2 days) 55.0% (-0.5 ppt) Non-luxury (35th-65th%) $380,782 (+6.1%) 831 (-2.5%) 44 days (+3 days) 50.7% (-4.7 ppt) Starter (5th-35th%) $240,429 (+9.6%) 536 (-3.4%) 45 days (+5 days) 37.3% (-5.6 ppt) Bottom (bottom 5%) $127,429 (+1.8%) 14 (0%) 38 days (-3 days) 28.6% (-7.1 ppt)
Redfin Analysis of MLS Data • Rolling 3-month period (March-May 2026)
Luxury homes were the most highly valued, up 10% from the previous year, with nearly half selling for more than the asking price. In the luxury sector, above-listing activity also accelerated dramatically, increasing by 11 percentage points and days on market fell by 11 days to 45 days. Luxury segment volume increased approximately 7%, reflecting true demand rather than a few outsized sales. At the top end (median price $593,000), prices rose about 4%, with more than half of the homes selling above listing.
The starter house told a different story. Although prices increased by a significant 9.6%, sales volumes fell by approximately 3% and listed activity decreased by nearly 6 percentage points. Homes in this bracket were sitting five days longer than a year ago. There were too few sales at the bottom (14) to draw reliable conclusions. Buyers in the higher price range faced stiff competition. Starter-level people had a little more room to negotiate terms.
How buyers and sellers can navigate the DuPage County, Illinois housing market
When shopping in DuPage County, speed is of the essence. More than half of homes go under contract within two weeks, and prices have increased about 9% over the past year. An encouraging development: New property listings increased by approximately 16% in June. This means there are more homes available now than at any time in the past year. Pay attention to the price range. The luxury and high-end home segments have the most competition, and starter homes require a little more time to evaluate your options.
When selling, the market favors confident pricing. Homes sold for about 1% above asking price on average, price reductions remained rare, and the median time on the market was 44 days. Sellers who priced at recent comparable levels were the earliest to start trading. The median time was just 44 days, and nearly 6 out of 10 listings closed within two weeks. But with inventory expanding, overpricing carries greater risk than it did six months ago. If you overshoot, you risk sitting around while decently priced homes move quickly around you.
Market Data by City for DuPage County, Illinois
Rolling three-month period (April to June 2026). Displays cities with 50 or more sales.
New sales listings for the city’s median sales price (year-over-year). Percent active DOM above supply Naperville $619,663 (+0.8% YoY) 511 752 1065 44 45.0% 2.9 Downers Grove $530,137 (+7.1% YoY) 200 248 359 41 51.9% 2.3 Elmhurst $699,619 (+8.1% YoY) 191 207 341 44 42.9% 2.2 Wheaton $535,958 (+15.0% YoY) 184 224 312 35 66.3% 2.1 Lombard $389,788 (+6.6% YoY) 179 219 321 42 48.1% 2.4 Bartlett $429,766 (+5.6% YoY) 176 197 303 44 51.9% 2.0 Woodridge $451,254 (+5.6% YoY) 137 153 225 42 49.4% 2.2 Glen Ellyn $604,671 (+11.1% YoY) 114 127 188 47 63.2% 2.1 Carol Stream $389,788 (+4.5% YoY) 113 140 218 45 64.7% 2.6 Hanover Park $344,812 (+4.8% YoY) 94 128 188 40 70.8% 2.9 Addison $404,570 (+3.7% YoY) 91 111 161 48 48.4% 2.2 Darien $479,739 (+11.1% YoY) 90 120 165 40 50.1% 2.3 Bloomingdale $402,281 (-4.2% YoY) 89 107 155 44 55.3% 2.1 Glendale Heights $336,816 (+12.8% YoY) 87 101 158 50 50.7% 2.2 Hinsdale $1,361,759 (+4.8% YoY) 78 108 158 45 38.2% 2.4 Westmont $429,766 (+1.5% YoY) 76 94 129 40 59.6% 2.2 Lyle $452,754 (+1.7% YoY) 69 104 142 42 46.4% 2.9 Villa Park $409,777 (+7.8% YoY) 63 74 107 43 64.7% 2.1 Roselle $434,514 (+28.2% YoY) 61 105 138 41 60.1% 3.3 Warrenville $359,804 (+2.8% YoY) 57 73 107 42 62.6% 2.4 Winfield $487,235 (+12.7% compared to previous year) 57 63 89 34 60.8% 1.5
This article was created in whole or in part using generative artificial intelligence (AI) technology with input from Chen Zhao, Head of Economic Research at Redfin. While efforts have been made to ensure the accuracy and reliability of this information, you should independently verify all data, facts, and quotes contained in this article before relying on the information for any purpose. This information is not intended to substitute for advice from a real estate agent, financial advisor, or other qualified professional. County-level data are not seasonally adjusted. For more detailed housing market data, check out the Redfin Data Center.
