


Dive into your real estate market and compare it to hundreds of other markets using Inman Market View’s interactive maps and charts.
After years of rapid growth in the number of active home listings, the U.S. housing market has seemingly reached a stable plateau in inventory levels.
But a closer look reveals that this plateau in national inventories masks a tug-of-war between markets at both ends of the inventory spectrum.
This phenomenon becomes apparent when you examine listing data from Realtor.com through the lens of the Inman Market View interactive tool available to all Inman subscribers. And in some regions, extreme conditions continue to accelerate.
In the three months to April, the number of active listings remained 14% below pre-pandemic levels, with inventory at about the same level as June last year.
Although housing inventory has settled to levels slightly below what was considered normal in the years leading up to the pandemic, we see significant regional variation.
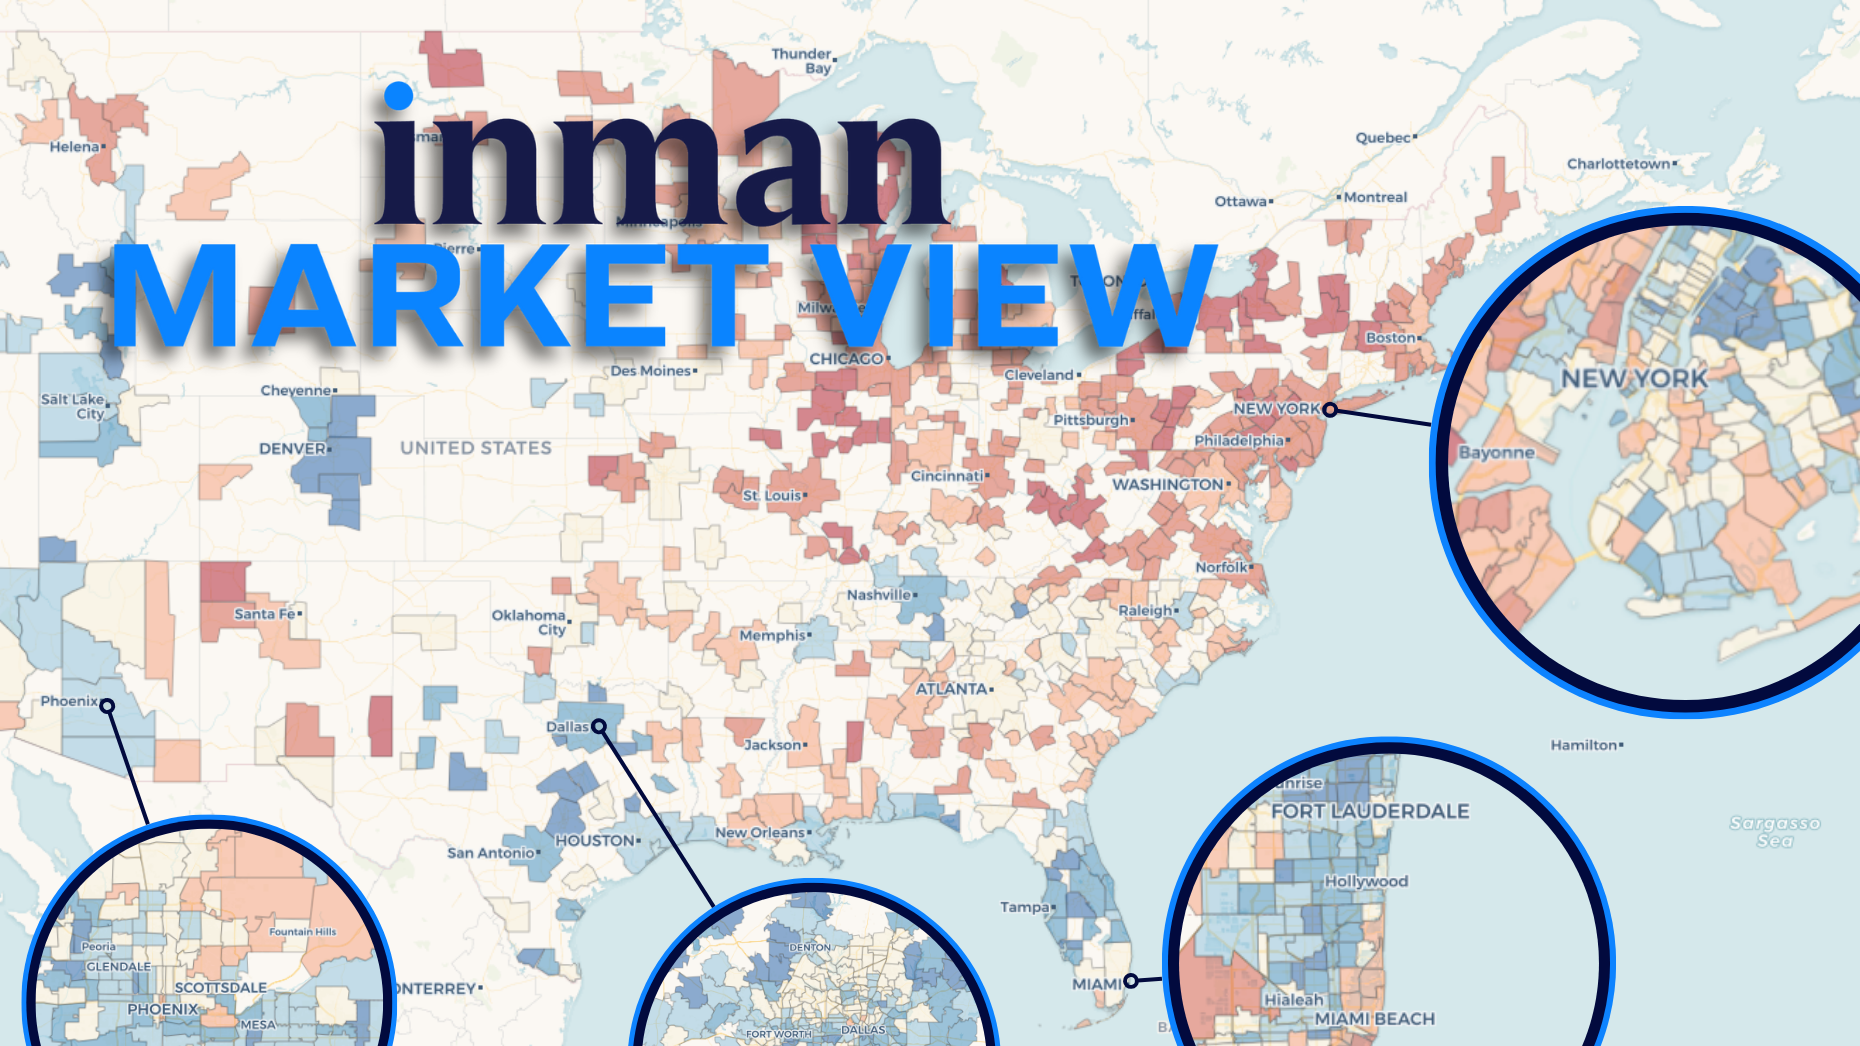
The map below shows how much inventory was distorted and expanded by the initial pandemic shock, the resulting boom in housing demand, and the associated crash in transactions and subsequent inventory rebalancing.
Click on one of the 500 local markets in the tool above or explore the options in the drop-down menu to explore the data in even more detail. For a more complete picture, choose to compare different metrics and time periods.
Recent months have seen renewed momentum in some of the nation’s largest housing markets, suggesting that while some markets may be converging on a national picture, others may be in even more trouble.
fork in the road
Real estate agents and brokerages in dozens of major markets are still seeing significant changes in inventory.
In some Florida markets, excess inventory that has accumulated over several years is now being absorbed or withdrawn from the market.
At Active List levels in Southwest Florida, particularly in metropolitan areas that include Cape Coral and Fort Myers, inventory levels went from 45 percent above pre-pandemic levels a year ago to 24 percent above that baseline in the three months ending in April. The same pattern can be observed in several other large Florida markets, from Miami to Jacksonville.
(Compare the path of your market to other markets by selecting from the drop-down menu above. You can also switch between different metrics and comparison views.)
Perhaps more extreme is the rapid increase in active listings in some of the country’s largest and most active tech hubs.
Inventories in the Seattle metropolitan area were already 32 percent above pre-pandemic levels at this time last year, but have since ballooned to an above-normal 81 percent.
And it’s not just Seattle.
What all of these high-tech cities, and others like Austin, have in common is a recent increase in new listings and a sharp decline in properties exiting the market due to pending sales or delisting, according to a Realtor.com data analysis.
These different trends appear to largely cancel each other out in national numbers. But they serve as a good reminder that American real estate is still a local game.
Furthermore, the world remains divided into the haves and have-nots.
Market divided by class
As home prices stagnate and the stock market continues to hit new highs, Americans with significant financial assets are in an increasingly better position to buy a home than those whose wealth is tied primarily to their primary residence.
And we saw clear traces of this in Miami.
One way to estimate housing demand is to look at the number of properties that have exited the market in the past three months, with most of them due to pending sales and a small number due to delistings. And then divide those by the number of active properties for sale at a given point in time.
We can see that the areas with unusually high demand in this region are the “blue” ZIP codes along Miami’s waterfront.
These are also the locations where typical unit prices are highest, as seen in the map below. And in lower-priced areas, demand for typical properties is lower than it was in pre-pandemic Miami.
Explore your own market by selecting a market in the drop-down menu above and toggling between different metrics and time period comparisons.
Email Daniel Huston