


It’s not just the biggest inventory growers that are seeing the flow of homes for sale slow. Some of America’s most list-hungry metros are losing ground again. Explore more with Inman Market View’s interactive maps and charts.
Since the number of new listings bottomed out several years ago, many local housing markets have seen a gradual influx of supply, which has helped rebalance conditions in buyers’ favor.
The pace of recovery is now slowing across the country, and may even plateau in regions where inventory recovery has been most pronounced.
But in parts of the market where new properties have been harder to find in recent months, supply has already been severely depleted and buyers and sellers are far from reaching parity, an Inman study of Realtor.com data suggests.
As the market continues to stabilize, the growth rate in the number of new listings fell from 3.8% year-on-year in the three months to October to 0.6% in the three months to January.
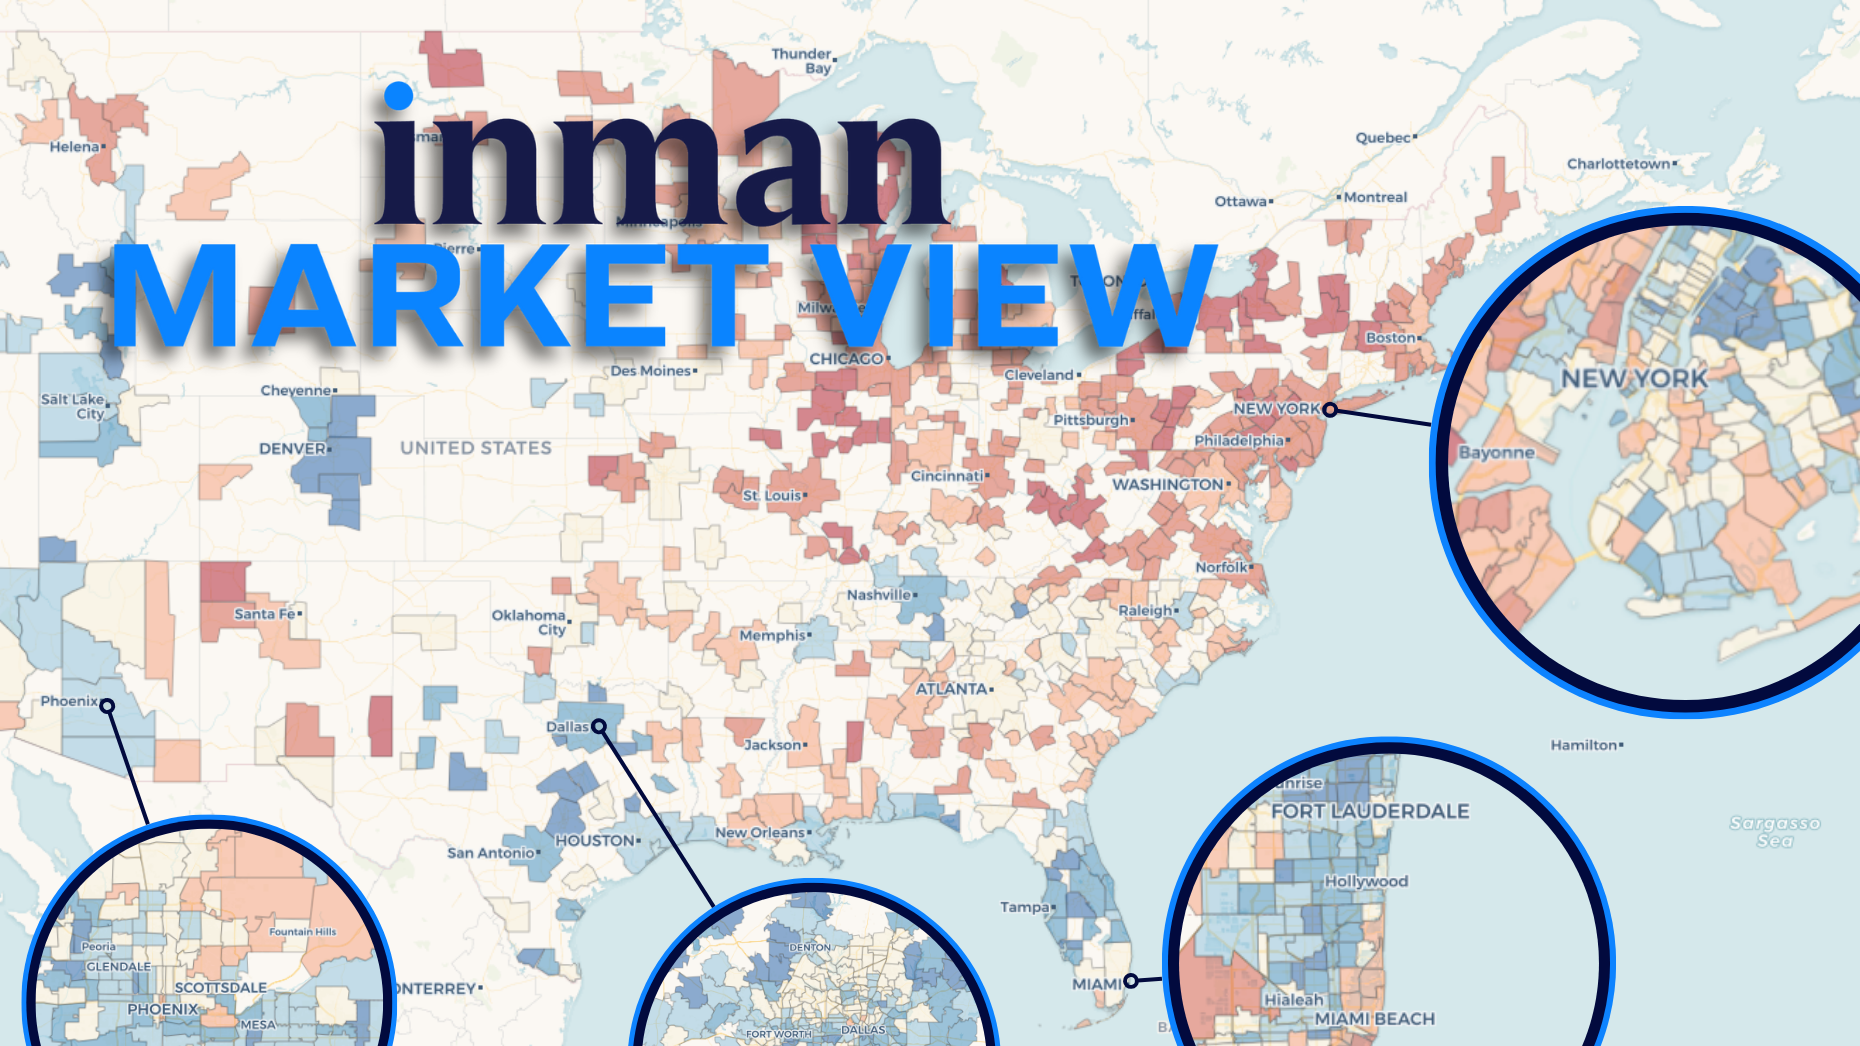
Explore the Inman Market View interactive data tool on this page to see how the markets compare.
Click on one of the 500 local markets in the tool above or explore the options from the drop-down menu to explore the data in even more detail. For a more complete picture, choose to compare different metrics and time periods.
coast to coast
The interactive map above shows that some major population centers, especially in the West, Northeast, and Midwest, are significantly less blue than they were three months ago.
This means that some coastal regions that once had impressive year-over-year listing gains in the fall have begun to plateau in the winter. And places where new listings were steady a few months ago are now losing momentum.
For real estate professionals in these regions, the decline in new listings is especially painful.
In the West and Northeast, the supply of new homes for sale never really recovered after the initial economic downturn as sellers exited the market.
As we saw above, inventory remains highly supply-constrained in the Midwest and Northeast, even though buyers have stopped bidding on homes. This has ensured that markets such as the Chicago, New York, and Philadelphia metropolitan areas will not be able to keep up with the national recovery in active listings.
And these three cities, like many others across the country, are currently experiencing slow growth in new listings, so the situation is unlikely to improve any time soon.
In the Northeast, these conditions supported strong price increases and helped property owners and agents weather a sharp downturn in transactions.
But Chicago and many of the more expensive markets on the West Coast were largely left out of the national housing price boom to begin with. And even the large losses in the initial public offering haven’t been a factor in pushing prices up significantly.
But just because new listing growth is slowing in these metro areas doesn’t mean it’s happening everywhere.
Using the chart above, you can search for your own market and compare its trajectory to other markets through various indicators and time comparisons.
neighborhood view
In Chicago, the number of new listings on the market from November to January was down 11% compared to the same period last year.
And it’s remarkable how widely this slide was felt across metropolitan areas.
Most local housing markets are not in a position like Chicago’s. About half remain at healthier listing levels than last year, with pockets of growth and stagnation across central cities and suburbs.
But the recovery in new listings that characterized the rebalancing era of pandemic recovery is increasingly slowing in more regions. Connect to the tool above to find out more.
Email Daniel Huston